Gross Processing or "Grossing" is the process by which pathology specimens undergo a visual examination, tissue sampling and dissection. The grossing duration of different specimens varies depending on the size, complexity and special procedures that are required as part of their dissection protocol in order to prepare the material for subsequent microscopic examination by the Pathologist during the reporting stage.
The Grossing Performance Details screen provides various information on the grossing process. It compares the average actual work time against the benchmarked work time, categorised in its sub-specialty as well as break down to the specimen type code and staff user codes.

The displayed information can be refined by selecting the data column/bar. For example, selecting a particular sub-specialty will update the specimen charts to filter down to specific specimen types codes. Additional information such as the volume of specimens grossed during the selected time period will also populate the specimen table.
Each histology specimen is assigned with a Specimen Type code at the start of the histology process. The code defines the type of specimen and the tissue sub-specialty. It also helps identify the grossing complexity. For example, biopsies are mostly transfer samples that do not require dissection and tissue resections require detailed visual examination and tissue sampling to ensure the lesions are adequately sampled for diagnosis.
Due to the variety of the different specimens, it is important that specimen types are taken into account when looking at the performance of the grossing work centre and staffing output.
The information can be used to monitor trends over an extended period to break down workload growth into specific subspecialty and specimen types, and support sizing the technical grossing work based on the specimen types and its average work time.
One of the charts available in the Grossing Performance Detail screen is the Minutes per Item bar chart broken down to the staff. Here, you can do a comparison between users and see how their performance compares by looking at their average work time by selecting a specimen type
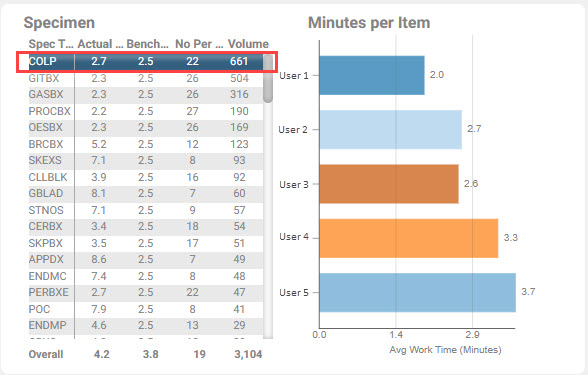
Alternatively, you can select a user bar and the screen will filter to present the data specific to the selected user code for the selected time period. For example, you can select User 1 from the Minutes per Item chart and a comprehensive list of all the specimens, volume and average actual work time will be available.